Financial Highlights
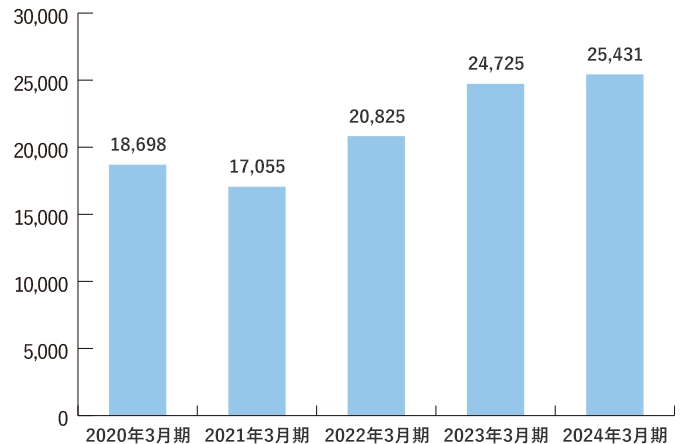
Net sales
(Billions of yen)
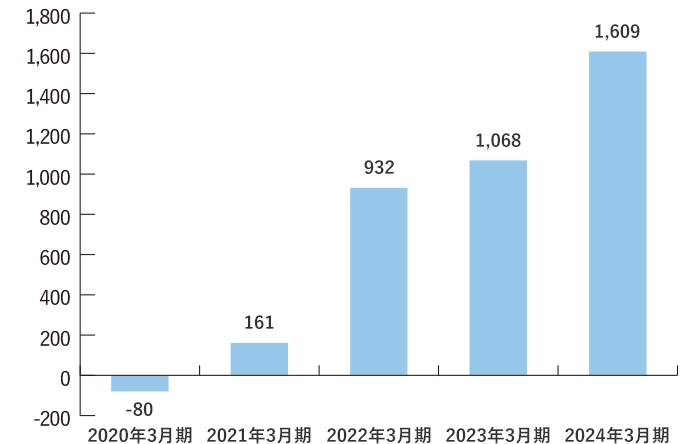
Ordinary profit (loss)
(Billions of yen)
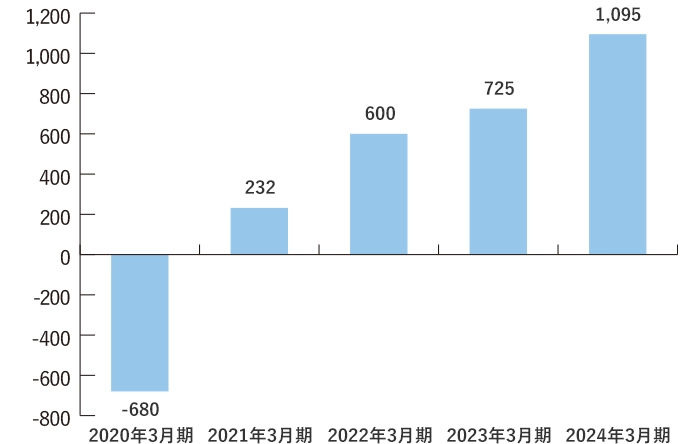
Profit (loss) attributable to owners parent
(Billions of yen)
Total assets
(Billions of yen)

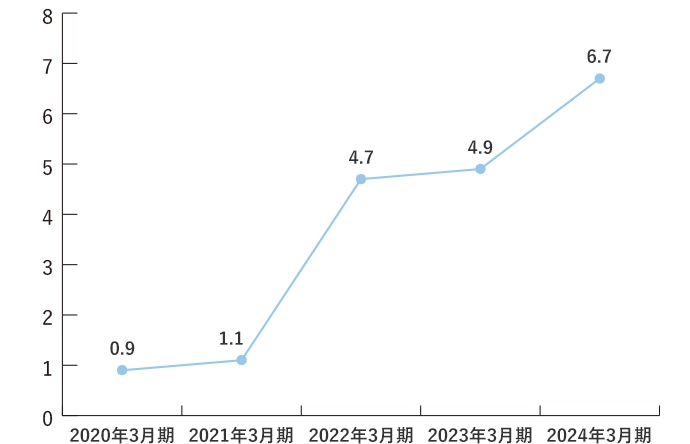
Return on invested capital (ROIC)
(%)
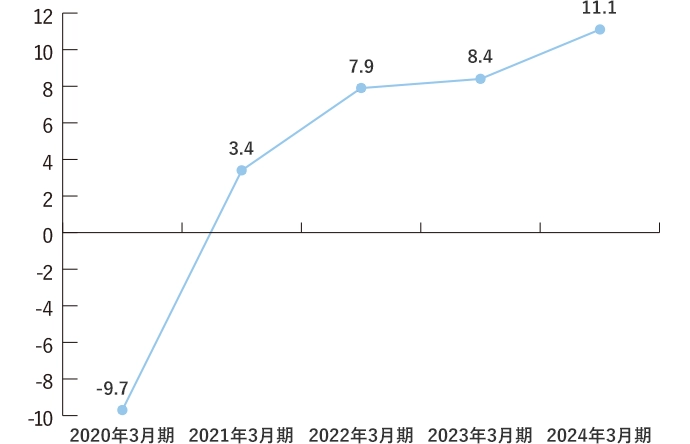
Return on equity (ROE)
(%)
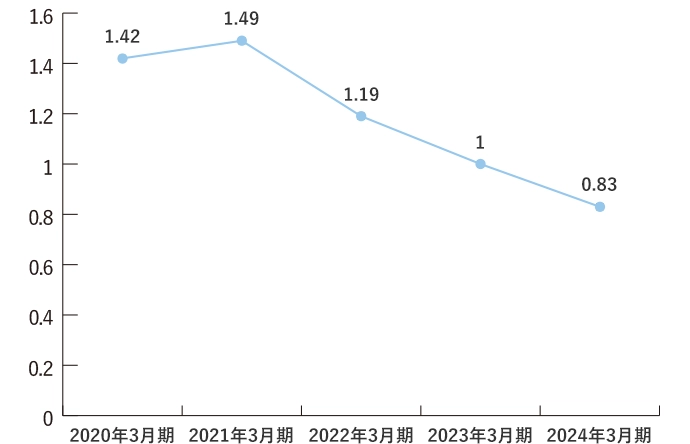
Debt/equity (D/E) ratio
(times)
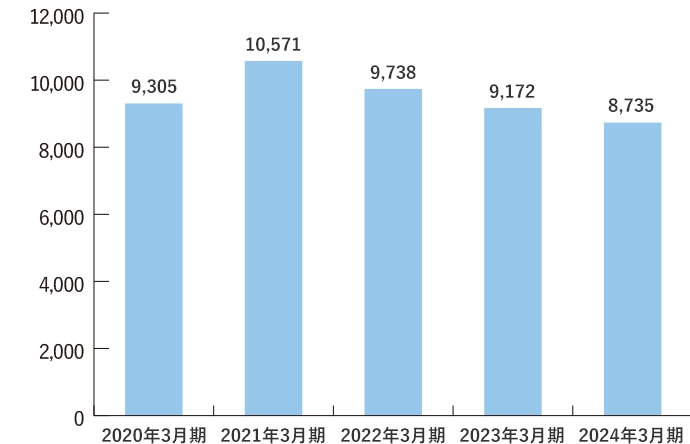
Interest-bearing debt
(Billions of yen)
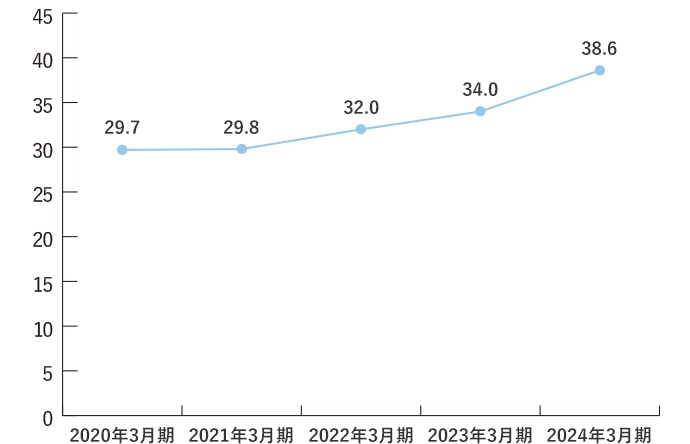
Net asset ratio
(%)
| FY2021 | FY2022 | FY2023 | FY2024 | FY2025 | |
|---|---|---|---|---|---|
| Net sales (Billions of yen) | 1,705.5 | 2,082.5 | 2,472.5 | 2,543.1 | 2,555.0 |
| Ordinary profit (loss) (Billions of yen) | 16.1 | 93.2 | 106.8 | 160.9 | 157.1 |
| Profit (loss) attributable to owners parent (Billions of yen) | 23.2 | 60.0 | 72.5 | 109.5 | 120.1 |
| Total assets (Billions of yen) | 2,582.8 | 2,728.7 | 2,874.7 | 2,919.7 | 2,891.0 |
| Return on invested capital (ROIC) (%) | 1.1 | 4.7 | 4.9 | 6.7 | 6.9 |
| Return on equity (ROE) (%) | 3.4 | 7.9 | 8.4 | 11.1 | 10.8 |
| Debt/equity (D/E) ratio (Times) | 1.49 | 1.19 | 1.00 | 0.83 | 0.76 |
| Interest-bearing debt (Billions of yen) | 1,057.1 | 973.8 | 917.2 | 873.5 | 886.3 |
| Net asset ratio (%) | 29.8 | 32.0 | 34.0 | 38.6 | 42.8 |
(At fiscal year-end)